


Steering Environment
The steering currents for a hurricane is the mean wind in a layer from about 850-mb to 200-mb. With the steering layer spanning from the lower to upper troposphere, the mid-tropospheric level of 500-mb can serve as a proxy for the steering current. Subtropical high-pressure systems, such as the Bermuda high, provide the mid-tropospheric steering currents. However, weather patterns can sometimes disrupt the high’s steering influence. Cape Verde storms, which are tropical cyclones that form within 1000km of the Cape Verde Islands (see map; Courtesy of the Department of Meteorology, Penn State University), tend to mirror the circulation of the Bermuda high. Ike developed to the west of these islands, making it a Cape Verde storm.
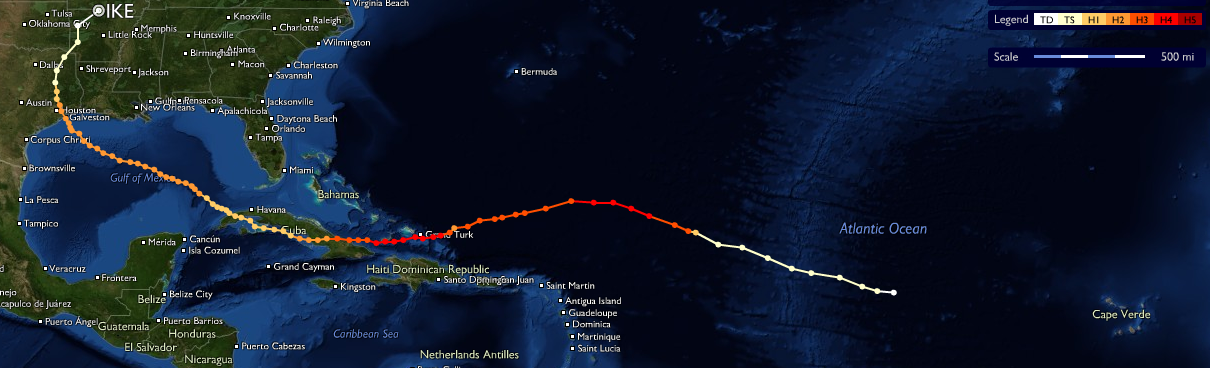
Hurricane Ike's track across the Atlantic and Gulf of Mexico, spanning from September 1st, 2008 to September 14th, 2008. (Courtesy of Stormpulse.)
After becoming a tropical storm, Ike tracked steadily to the west-northwest as it was steered along by the clockwise circulation of the subtropical high. It would keep this west-northwesterly track as it strengthened into a Category 1 hurricane. As Ike intensified to a Category 4, its movement shifted to a more westerly, and then west-southwesterly direction as it made its way towards the Turks and Caicos Islands, where Ike’s impact was first felt.
From there, Ike took a westerly track as it headed towards Cuba. After crossing southern Cuba, the weakened Category 1 Ike shifted to a more west-northwesterly direction to bring it across northern Cuba for a second landfall, and then into the Gulf of Mexico. Ike’s movement remained west-northwesterly as it strengthened into a Category 2 storm and made its way across the Gulf of Mexico. Just before making landfall, Ike’s track shifted more northwesterly to bring the hurricane into Galveston, Texas.
The 500-mb Vector Wind Composite Mean, ranging from September 1st, 2008 to September 13th, 2008, shows the mid-tropospheric winds to be generally out of the east-southeast to east along Ike's track, with a subtropical high to the north. (Courtesy of the Earth System Research Laboratory.)
The 500-mb Vector Wind Composite shows that Ike’s track was generally consistent with the steering currents. Mid-tropospheric winds, in the range of 7 to 11 knots, along Ike’s track were east-southeasterly to east as they circulated around the southern edge of the subtropical high. This helped steer Ike in a general west-northwesterly to westerly direction. In the Gulf of Mexico, the winds decreased in speed to less than 7 knots, which caused Ike to slow down, and shifted a little more to the southeast. This eventually directed Ike towards landfall in Texas.
Easterly Wave
Hurricane Ike got its start as an easterly wave off the coast of Africa. Easterly waves are tropical disturbances that originate at low latitudes over Africa, north of the equator, and travel westward across the Atlantic. They move off the coast of Africa every three to four days between the months of June through October, and are relatively intense as they reach western Africa. Easterly waves provide seedling circulations for tropical cyclones and initiate 85% of all major Atlantic hurricanes.
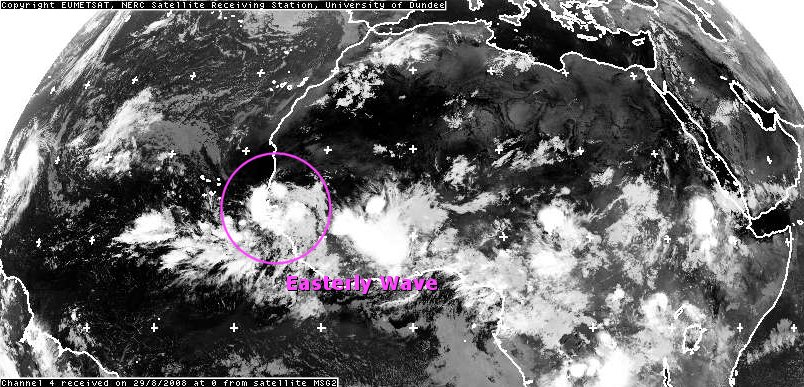
The infrared satellite image, from 00Z on August 29th, 2008, shows the easterly wave that would provide the seed for Hurricane Ike to develop moving off the western coast of Africa. (Courtesy of Dundee Satellite Receiving Station.)
On August 29th, 2008, an easterly wave moved off the coast of Africa, as can be seen on the infrared satellite image. It was this easterly wave that provided the seed for Ike. As the disturbance drifted off to the west-northwest, the convection associated with it became more organized and strengthened into a tropical depression on September 1st, 2008. From there, it would intensify to a tropical storm later that day, then eventually a major hurricane.
Favorable Conditions for Strengthening
At the time when Hurricane Ike formed, conditions were favorable for tropical cyclones to develop and intensify. On September 3rd, 2008, the day Ike reached hurricane status, sea-surface temperatures were around 27°C in the area where Ike was developing. Temperatures over 26.5°C favor the development and intensification of tropical cyclones. This is due to warm sea-surface temperatures increasing the evaporation rate, which provides fuel for hurricanes.
The Sea-Surface Temperature Composite Mean, from September 3rd, 2008, shows temperatures to be favorable for the development and intensification of tropical cyclones. (Courtesy of the Earth System Research Laboratory.)
Mid-tropospheric relative humidity also has an effect on whether a hurricane develops and intensifies or not. Ahead of the developing Ike was an area of relatively dry air, as can be seen on the water vapor image from September 3rd, 2008. This is what likely contributed to Ike’s slow intensification from a tropical storm to a hurricane. However, relatively moist air from the south was being pulled into Ike’s circulation, which helped to strengthen Ike into a hurricane that day.
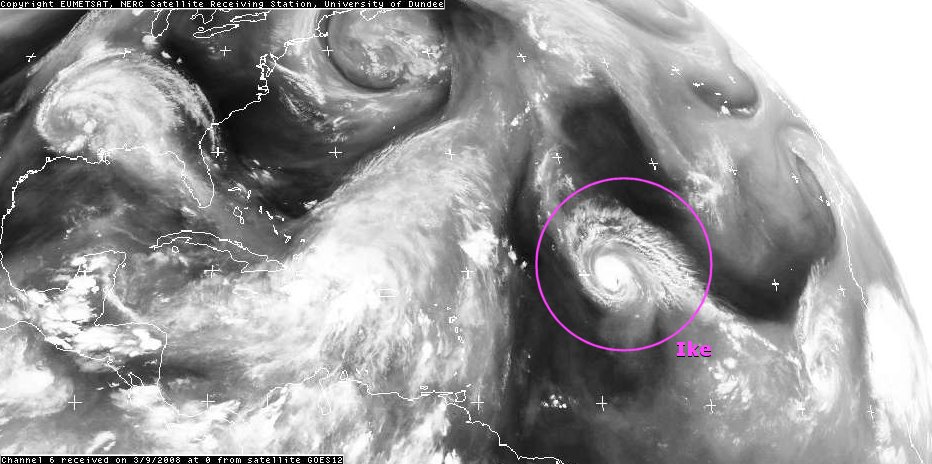
The water vapor image, from 00Z on September 3rd, 2008, shows relatively dry mid-tropospheric air ahead of the developing Ike, as well as relatively moist mid-tropospheric air to the south being drawn into its circulation. (Courtesy of Dundee Satellite Receiving Station.)
Vertical wind shear was also in Ike’s favor on September 3rd, 2008. The wind shear image shows relatively weak vertical wind shear of approximately less than 15 knots in Ike’s general location, which is a favorable amount for development. The strong westerly shear that would have been destructive to Ike was well to the northwest.
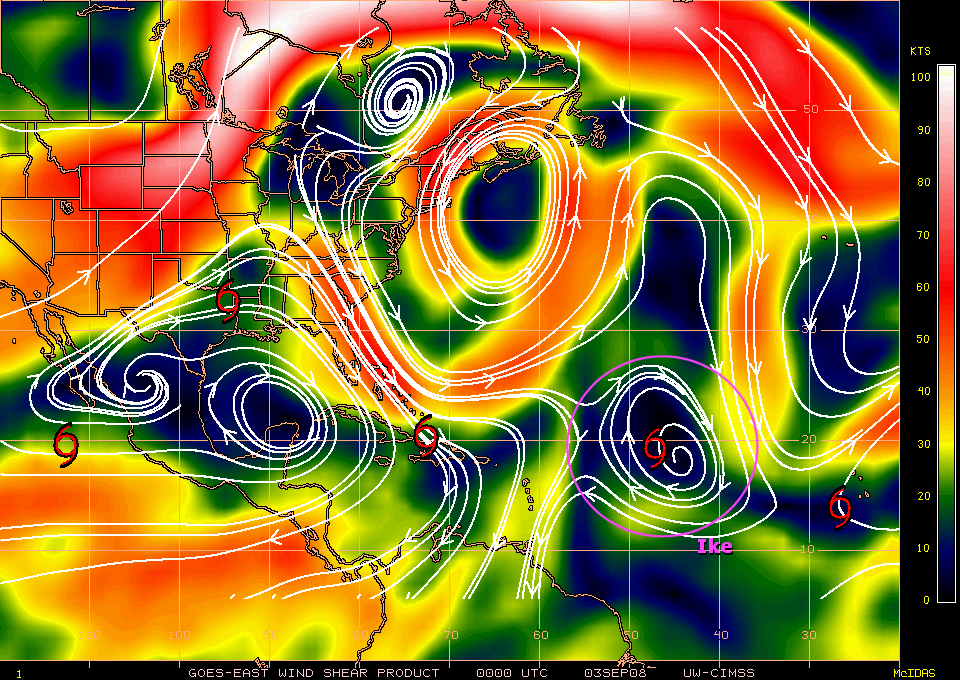
The vertical wind shear image, from September 3rd, 2008, shows weak vertical wind shear in Ike's general location. (Courtesy of the Cooperative Institute for Meteorological Satellite Studies/University of Wisconsin-Madison.)
Eyewall Replacement Cycle
On September 7th, 2008, Hurricane Ike began to undergo an eyewall replacement cycle as it approached southern Cuba. An eyewall replacement cycle is when the original eyewall collapses and is replaced by an eyewall farther away from the center of the storm. This process starts when an outer band of thunderstorms encircles the inner eyewall, which shuts down the inner eyewall’s access to moisture. Eventually, the inner eyewall collapses and the outer eyewall becomes the new eyewall. With the new, wider eyewall in place, this causes the hurricane to weaken due to the increased radius of maximum winds.
To document an eyewall replacement cycle, a MIMIC (Morphed Integrated Microwave Imagery at CMISS) image is used. These are successive microwave images that are digitally manipulated to create an animation that makes the imagery appear to naturally morph into each other. The colors on the image represent brightness temperature and indicate the distribution of precipitation. Cooler temperatures are associated with the most intense convection, where precipitation is heaviest, and warmer temperatures indicate lighter precipitation.
(Click to play animation.)
The MIMIC image of Hurricane Ike undergoing an eyewall replacement cycle on September 7th, 2008. (Courtesy of Morphed Integrated Microwave Imagery at CMISS.)
The MIMIC image, from September 7th, 2008, shows an outer eyewall forming around Ike’s inner eyewall. As the outer eyewall intensifies, the inner eyewall begins to weaken, as can be seen by the increase in brightness temperature. It was at this time that Ike weakened from a Category 4 to a Category 3, with estimated maximum winds diminishing from 115 knots to 105 knots.
Ike underwent another eyewall replacement cycle after entering into the Gulf of Mexico (see MIMIC image; Courtesy of Morphed Integrated Microwave Imagery at CMISS). This is what likely prevented Ike from rapidly intensifying over the warm Gulf waters to make landfall in Texas as a Category 2.
