


Little Rock Climatology
Little Rock, Arkansas is located on a dividing line between the Ouachita Mountains to the west of the city and the flat lowlands of the Mississippi River Valley to the east, as can be seen on the topographical map of the state. According to the Local Climate Data, Adams Field Airport in Little Rock lies at an elevation of 253 feet. The topography can cause there to be two slight variations in temperatures at the airport. At night, cold air draining down the Ouachita Mountains due to net radiational cooling of the mountain slopes can cause slightly lower minimum temperatures at the airport. Also, a slight downslope adiabatic heating effect can accompany airflow from the ridges and hills to the west and northwest of the airport, which would result in the possibility of slightly warmer temperatures.
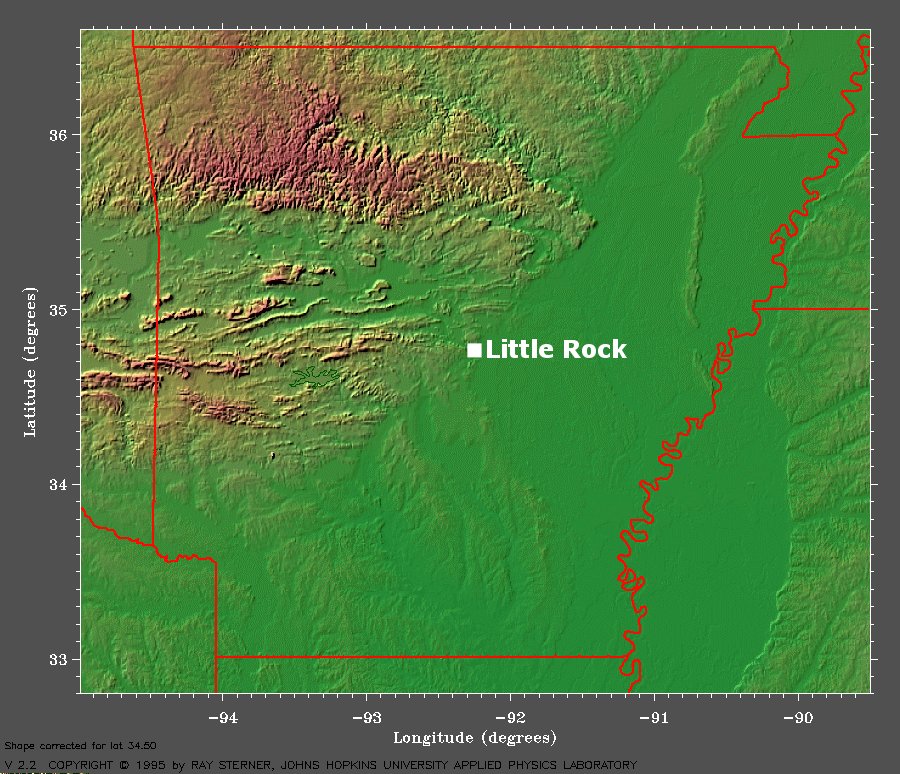
The topographical map of Arkansas shows that Little Rock is situated between the Ouachita Mountains to the west of the city and the flat lowlands of the Mississippi River Valley to the east. (Courtesy of Johns Hopkins University.)
Little Rock has a modified continental climate and the city is exposed to all types of North American air masses. The winter months are typically mild, but polar and Arctic outbreaks are not unusual. Snowfall is rare; however, ice storms can occur and are sometimes severe, although they are infrequent. Conditions become favorable for ice storms when warm, moist air from the Gulf of Mexico is drawn in over Arkansas and overruns a shallow layer of cold air at the surface on the cool side of a warm front. Arkansas’ proximity to the Gulf of Mexico allows for easily accessible moisture and southerly winds aid in transporting the warm, moist air northward over the state.
The February wind rose for Adams Field Airport shows that the most frequently observed wind direction for the month is west-southwesterly and occurs just over 8% of the time. However, Little Rock sees its fair share of other wind directions with northerly, northeasterly, east-northeasterly, northwesterly, and southwesterly winds occurring approximately 7% of the time. In addition, winds out north-northwest, north-northeast, and south-southeast occur around 6% of the time, while winds out of the west-northwest, east-southeast, east, and south-southwest occur approximately 5% of the time. Winds out of the west, south, and south-southeast occur 4% of the time.
The wind rose for Adams Field Airport shows that the most frequently observed wind direction for the month of February is west-southwesterly. (Courtesy of the National Water and Climate Center.)
Throughout February, wind speeds between 1.8 m/s (3.5 knots) and 3.34 m/s (6.5 knots) occur approximately 4% of the time. Wind speeds between 3.34 m/s (6.5 knots) and 5.4 m/s (10.5 knots) occur around 3% of the time, and wind speeds between 5.4 m/s (6.5 knots) and 8.49 m/s (16.5 knots) occur about 2% of the time. According to the Local Climate Data for Little Rock, the maximum observed 2-minute wind speed for February is 47 mph (41 knots).
By March, west-southwesterly is still the most frequently observed wind direction, according to the March wind rose for Adams Field Airport, and occurs just under 8% of the time. Southerly, south-southwesterly, southwesterly, and southeasterly winds are also common and occur approximately 7% of the time. Northwesterly, east-northeasterly, east-southeasterly, and south-southeasterly winds occur approximately 6% of the time, while west-northwesterly, north-northwesterly, northerly, north-northeasterly, northeasterly, and easterly winds occur about 5% of the time. Westerly winds occur around 4% of the time.
The March wind rose for Adams Field Airport shows that west-southwesterly is the most frequently observed wind direction for the month. (Courtesy of the National Water and Climate Center.)
For March, wind speeds between 1.8 m/s (3.5 knots) and 3.34 m/s (6.5 knots) occur approximately 3% of the time, and wind speeds between 3.34 m/s (6.5 knots) and 5.4 m/s (10.5 knots) occur close to 4% of the time. Wind speeds between 5.4 m/s (6.5 knots) and 8.49 m/s (16.5 knots) occur about 3% of the time. The Local Climate Data indicates that the maximum observed 2-minute wind speed for March is 37 mph (32 knots).
According to the Daily Almanacs for the first forecasting week (February 23rd, February 24th, February 25th, and February 26th), the normal daily high for February 23rd and 24th is 58°F and the normal daily high for February 25th and 26th is 59°F. The record high temperatures are, chronologically, 82°F, 78°F, 83°F, and 83°F, and the record lowest maximum temperatures for this period are, chronologically, 28°F, 28°F, 27°F, and 30°F.
The normal daily low temperature for February 23rd, 24th, and 25th is 37°F and the normal daily low temperature for February 26th is 38°F. The record low temperatures are, chronologically, 16°F, 17°F, 16°F, and 21°F, and the record highest minimum temperatures are, chronologically, 58°F, 64°F, 63°F, and 64°F.
The average daily precipitation for February 23rd, 24th, 25th, and 26th is consistently 0.13 inches and the record daily precipitation is, chronologically, 1.74 inches, 2.06 inches, 1.34 inches, and 2.71 inches.
The Daily Almanacs for the second forecasting week (March 2nd, March 3rd, March 4th, and March 5th), indicate that the normal daily high temperature for March 2nd and 3rd is 60°F and the normal daily high temperature for March 4th and 5th is 61°F. The record high temperatures are, chronologically, 80°F, 83°F, 83°F, and 80°F and the record lowest maximum temperatures for these days are, chronologically, 32°F, 31°F, 34°F, and 30°F.
For March 2nd, 3rd, and 4th, the normal daily low temperature is 39°F and for March 5th, the normal daily low temperature is 40°F. The record low temperatures are, chronologically, 15°F, 11°F, 15°F, and 17°F, and the record highest minimum temperatures for this period are, chronologically, 63°F, 65°F, 66°F, and 64°F.
The average daily precipitation for March 2nd, 3rd, 4th, and 5th is consistently 0.14 inches and the record daily precipitation is, chronologically, 1.64 inches, 2.31 inches, 1.91 inches, and 1.67 inches.
