 << Back

Weather Station Assignment #8:
In the eighth Weather Station Assignment, I worked with GFS forecast maps for predicting precipitation over Europe. The assignment was to first get a map of predicted 500-mb heights, along with predicted precipitation. By studying the 500-mb heights, I was able to locate a short-wave trough. Then I had to make sure the trough had a significant area of precipitation on its eastern side. After I located an area that fit the criteria, I then had to pick a major city within the area. Then after the time passed for when the forecast map was valid (24 hours in my case), I had to get a METAR for the city I chose around the forecast time to check weather conditions. Then I would be able to see if the precipication forecast was accurate or not.
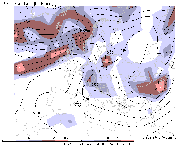
The city I chose was Van, Turkey. Here is my first and second assignment posts along with the precipitation/500-mb heights forecast map.

First Post:
24 Hour Forecast Valid 00Z 03/16/2009Van, Turkey (LTCI)
Second Post:
Conditions at: LTCI observed 15 March 2009 23:50 UTCTemperature: -1.0°C (30°F)
Dewpoint: -1.0°C (30°F) [RH = 100%]
Pressure (altimeter): 29.70 inches Hg (1006.0 mb)
Winds: from the W (280 degrees) at 6 MPH (5 knots; 2.6 m/s)
Visibility: 2.49 miles (4.01 km)
Ceiling: 2000 feet AGL
Clouds: broken clouds at 2000 feet AGL
overcast cloud deck at 7000 feet AGL
Present Weather: -SN BR (light snow, mist)
Light snow and mist was reported in Van, Turkey at 00Z which would make the precipitation forecast map accurate.

12-Hour Precipitation/500-mb Forecast Map

Reflection:
I learned a lot from this assignment and from studying the precipitation/500-mb heights forecast maps. It was really interesting to look for short wave troughs and then find where precipitation would most likely be falling, then to see that the forecast was accurate. Back in mid March, a snowstorm was in the forecast and I checked a few of the precipitation/500-mb heights forecast maps to locate the short wave trough associated with the coming low pressure system. With the knowledge from this lesson, I was able to interpret the maps to tell that the brunt of the snowstorm would miss us (although the local tv stations were forecasting ten inches), and we ended up with around two inches. So this assignment was very helpful with putting what I learned into practice and being able to use the skills taught for forecasting possible precipitation at home.


