


Mesoscale Details
In order for there to be a severe weather outbreak, many ingredients must come together, both on the synoptic-scale level and on the mesoscale level. Conditions need to be just right for supercells to develop and tornadogenesis is an even more complex process. In this section, I will explain the mesoscale details on June 17th, 2009 that contributed to the severe weather outbreak and the Aurora, Nebraska tornado.
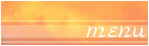
By 9:04 pm CDT, the powerful parent supercell responsible for producing the tornado was approaching the city of Aurora, as can be seen on the 0204Z base reflectivity. It had the classic supercell appearance with a prominent hook echo. The supercell also had a well-defined V-notch, which is the signature of a strong supercell. A V-notch develops when upper-level winds are forced to diverge around the storm’s powerful updraft, providing the updraft is of a higher momentum than the upper-level winds.
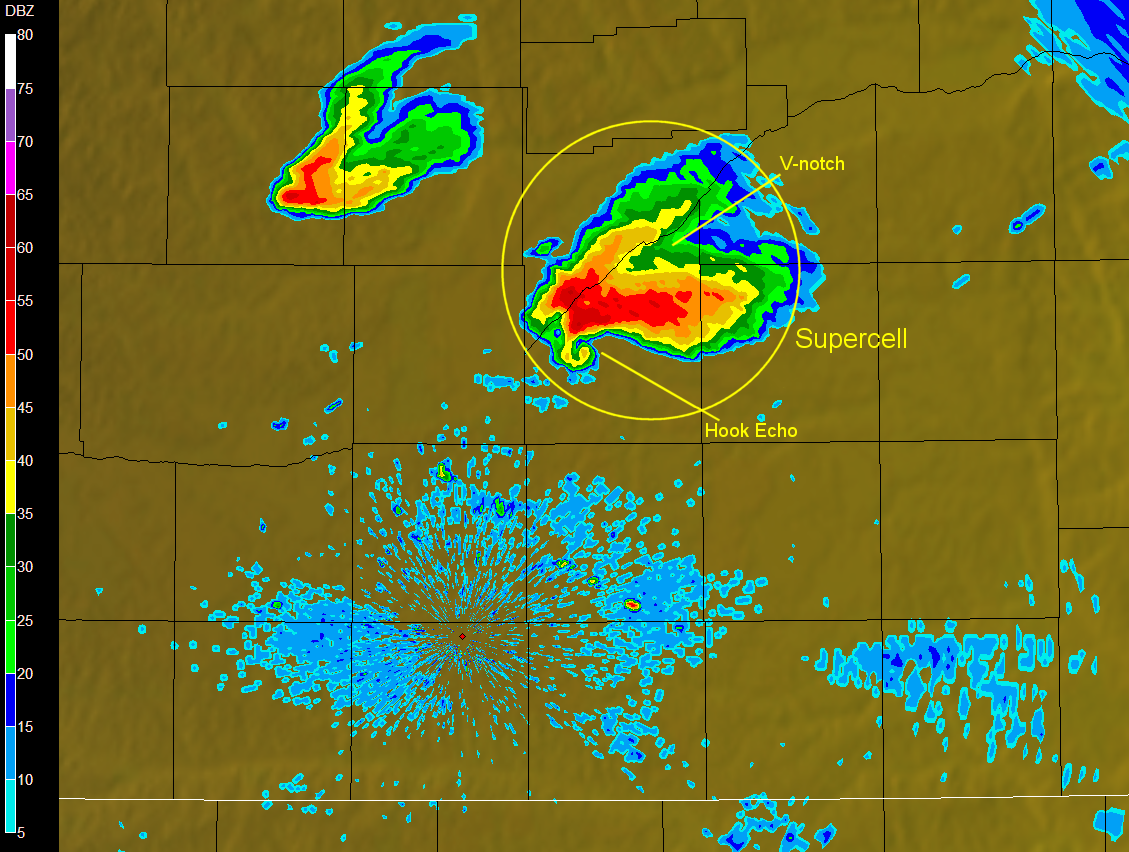
At the same time, 0204Z storm-relative winds indicated a velocity couplet associated with the hook echo of the supercell (the supercell was producing the tornado west of Aurora at that moment). Gate-to-gate shear was approximately 105 knots, and since Aurora is around 40 km from the radar site in Hastings, it is likely a TVS was detected.
|
|
The 0204Z base reflectivity from June 18th, 2009 (left) shows the powerful supercell approaching Aurora, Nebraska. The 0204Z storm-relative winds from June 18th, 2009 (right) indicates a velocity couplet associated with the hook echo of the supercell. (Courtesy of the National Weather Service from Hastings, Nebraska (KUEX).)
Prior to this tornadic supercell erupting, there would need to be sufficient energy in the atmosphere for convective development once air parcels were able to reach their LFC. This is where MLCAPE/MLCIN comes in to measure the Convective Available Potential Energy and Convective Inhibition. Mixed-Layer CAPE/CIN is different than Surface-Based CAPE/CIN since it takes into account the mixing of air that occurs within the boundary layer. It is derived from using the mean mixing ratio and mean potential temperature to find a more accurate LCL height.
The 01Z 100-mb MLCAPE/MLCIN map indicated very large values of MLCAPE in excess of 4000 J/KG over a good portion of south-central Nebraska. MLCIN values were rather weak and between 25 and 100 J/KG, with a few spots less than 25 J/KG close to the Aurora area. Such a large value of MLCAPE indicates a high degree of instability, and with very little MLCIN, there would be plenty of energy for the development of the Aurora tornadic supercell.
The 01Z 100-mb MLCAPE/MLCIN map from June 18th, 2009 shows MLCAPE values over south-central Nebraska to be in excess of 4000 J/KG with weak to no MLCIN remaining. Circled in black is the approximate area around Aurora, Nebraska. (Courtesy of the Storm Prediction Center.)
However, for the development of the tornadic supercell, it would not matter what the MLCAPE value was if there was no vertical wind shear present. Wind shear is necessary for both supercells and tornadogenesis within supercells. The 01Z 0-6km shear map shows an area of wind shear ranging from 45 to 55 knots over south-central Nebraska. This amount of vertical wind shear was sufficient for the development of the Aurora tornadic supercell and would also contribute to tornadogenesis.
The 01Z 0-6km shear map from June 18th, 2009 shows vertical wind shear in the range of 45 to 55 knots over the area of Aurora, Nebraska, which is supportive of supercells. (Courtesy of the Storm Prediction Center.)
More importantly, for the measure of potential tornadic development within a storm, is the storm-relative helicity. Storm-relative helicity is the speed at which the storm’s updraft ingests streamwise vorticity, which is horizontal vorticity aligned with the storm-relative inflow within the boundary layer. The updraft then vertically tilts the horizontal vorticity after ingesting it (see image; Courtesy of the Department of Meteorology, Penn State University). The higher the storm-relative helicity, the greater the tornado threat within supercells.
At 01Z, the 0-1km storm-relative helicity values over south-central Nebraska were in the range of 150 to 300 m²s¯². Values above 100 m²s¯², for storm-relative helicity at 0-1km, indicate an increased tornado threat with supercells. The values in south-central Nebraska were well above this, which is likely one reason why the area was under a tornado watch.
The 01Z 0-1km storm-relative helicity map from June 18th, 2009 shows storm-relative helicity values over the area of Aurora, Nebraska to be in the range of 150 to 300 m²s¯². Values of 0-1km storm-relative helicity over 100 m²s¯² suggest an increased threat of tornadoes with supercells. (Courtesy of the Storm Prediction Center.)
With these three key features indicating the potential of tornadic supercells, it is important to figure out storm motion in order to find the movement of the supercells. This is done by applying the Rasmussen Technique on a hodograph.
To apply the Rasmussen Technique, we start off with plotting the surface wind (see 01Z METAR from Aurora on June 18th, 2009) on a hodograph. According to surface observations at 01Z, the wind at Aurora was 90° at 6 knots. The next step is to plot the wind at 4 km (see 00Z sounding from Hastings, Nebraska on June 18th, 2009; Courtesy of NOAA and Penn State University), which was 227° at 25 knots. A line is then drawn between the two points and the 60% mark of the line is located. After that, another line the length of 17 knots is drawn at a 90° angle to the right of the 60% mark. The end of this line marks the storm motion.
By applying the Rasmussen Technique on the hodograph, we see that the Aurora supercell is moving from the west-northwest (279°) to the east-southeast (99°) at 19 knots.
The storm motion of the Aurora supercell was 99° while the storm motion vector was 279°. In other words, the supercell moved from the west-northwest (279°) to the east-southeast (99°). The speed of the storm was 19 knots.
In conclusion, conditions were favorable for a severe weather outbreak in the Central Plains on June 17th, 2009. Both the synoptic-scale and mesoscale features provided an environment that was supportive for development of tornadic supercells over the region. This is what led to the supercell that spawned the Aurora, Nebraska tornado, as well as multiple other tornadoes that day.
<< Back | Top | End >>
