

Lesson Learned
As can be seen on the meteogram for Fargo (see image; Courtesy of the University of Wyoming) covering the time of the forecast period, no precipitation fell (also see METARs). Since I had forecasted 0.12 inches to fall, this ended up being a pretty big bust.
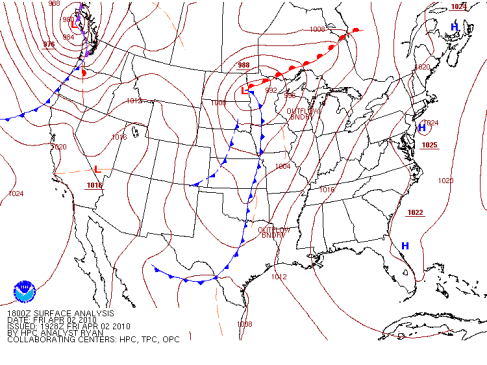
The 18Z surface analysis from April 2nd, 2010 showed the center of the low pressure system almost directly over Fargo instead of in central Minnesota as had been forecasted. (Courtesy of the Hydrometeorological Prediction Center.)
The 18Z surface analysis from April 2nd, 2010 showed that the center of the low pressure system ended up moving a little more northerly than what was originally anticipated and brought it almost directly over Fargo. From this same time, the visible satellite image showed the low pressure system taking on the comma shaped appearance of a mid-latitude cyclone with a dry slot behind the cold front.

The 18Z visible satellite image from April 2nd, 2010 showed the low pressure system taking on the classic mid-latitude cyclone comma shaped appearance with a dry slot behind the clouds associated with the cold front. (Courtesy of the National Center for Atmospheric Research.)
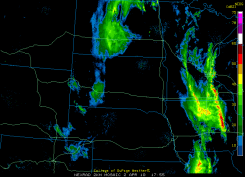
The 18Z water vapor image showed how the dry conveyor belt was transporting drier air from the southwest into the low pressure system. The effects of this could be seen on the radar image from the same time with a gap in the precipitation over Fargo. Precipitation was located to the east and west where the upper troposphere was relatively moist.

|
|
The 18Z water vapor image (left) from April 2nd, 2010 showed how drier air was being drawn northward into the low pressure system. (Courtesy of the Storm Prediction Center) The 18Z radar image (right) from April 2nd, 2010 showed how there was a gap in the preciptation over Fargo where the drier air was being pulled in (national view and radar loop). (Courtesy of University Corporation for Atmospheric Research.)
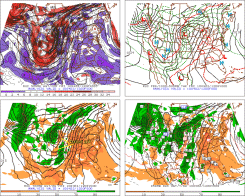
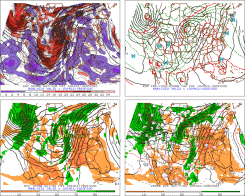
The 12Z RUC analysis also showed how drier air at 700-mb was working its way into the low pressure system with relative humidity values around 50% over Fargo and even lower values south. At that time, relative humidity values at 850-mb were still 70% near Fargo. However, by 18Z, relative humidity values at 700-mb and 850-mb had dropped to 30% over Fargo. The higher values west and east fit the areas of precipitation in the radar image above, with the area of dry air over Fargo coinciding with where there was a lack of precipitation.
|
|
The 12Z RUC analysis (left) for April 2nd, 2010 showed lower relative humdity values at 700-mb entering North Dakota as the drier air made its way northward. The 18Z RUC analysis (right) for April 3rd, 2010 showed how relative humidity values at 700-mb and 850-mb had dropped to 30% over Fargo. (Courtesy of Penn State University.)
The 18Z RUC sounding confirmed the drier air above Fargo and also gave a better picture of it. As can be seen on the sounding, there was a deep layer of dry air beginning at about 825-mb.
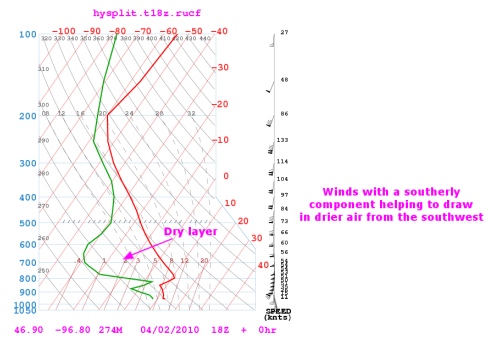
The 18Z RUC sounding from April 2nd, 2010 showed a deep layer of dry air over Fargo and winds with a southerly component throughout the troposphere which aided in transporting drier air from the southwest. (Courtesy of the Air Resources Laboratory.)
Prior to making my precipitation forecast, it would have been wise to consider the possibility of dry advection occurring due to the dry conveyor belt that accompanies mid-latitude cyclones. One thing that may have helped me get a better idea of where potential dry advection might take place was to check the mixing ratio forecast. The 18Z mixing ratio analysis for 700-mb showed dry advection occurring as drier air from the southwest was being drawn into the low pressure system.
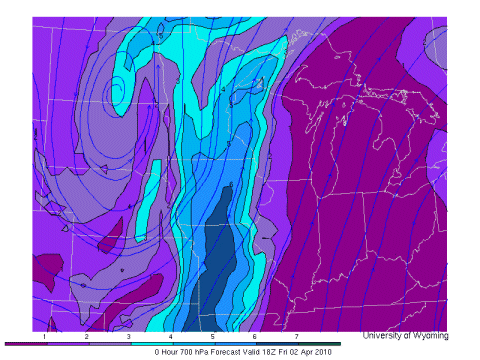
The 18Z 700-mb mixing ratio analysis with wind streamlines showed how dry advection was occurring over Fargo. (Courtesy of the University of Wyoming.)
The biggest lesson learned from this particular experience was to be more mindful of the big picture concerning the track of a low pressure system. The progs had predicted a lack of precipitation south of Fargo in response to the center of the low pressure system forecasted to be in central Minnesota. Being that the low's center ended up in eastern North Dakota, this put Fargo in the dry area and threw off the precipitation forecast. In the end, it was not wise to have planned on an area of heavier precipitation developing behind the warm front (especially since forecasted 700-mb RH values were never high over Fargo) and I should have given more consideration to the possibility of dry advection affecting Fargo.
 << Back | Top | End >>


