

The Big Picture
When I created my precipitation forecast for April 2nd, 2010 that would bust, I had a feeling it might be a tricky forecast. The 18Z surface analysis for April 1st, 2010 showed a warm front stretched across Minnesota that extended southwest all the way into Colorado where there was also a cold front and surface lows.
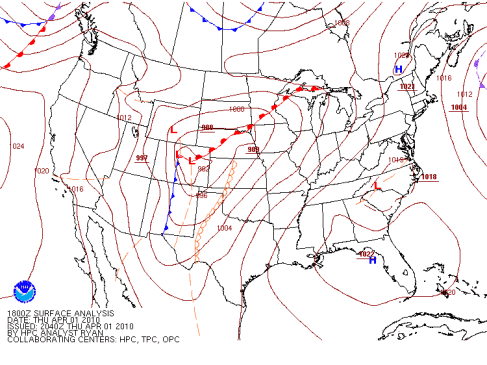
The 18Z surface analysis from April 1st, 2010 showed a warm front across Minnesota that extended into Colorado where there was a cold front and surface lows. (Courtesy of the Hydrometeorological Prediction Center.)
Throughout the day on April 2nd, the warm front was forecasted to lift northward through Minnesota as the center of the low pressure system and cold front approached from the southwest. The low's center was to pass just east of Fargo by 18Z as the cold front moved across Minnesota. On the backside of the warm front and low, an area of precipitation was expected to spread across North Dakota. According to the surface forecasts, Fargo was to be in an area of precipitation for much of the forecast period.
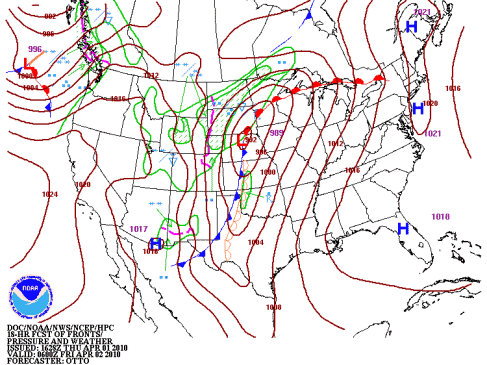
(Click image to play forecast loop.)
The 18-hr surface forecast, valid at 06Z on April 2nd, 2010, showed the warm front beginning to move northward through Minnesota by the start of the forecast period with an area of precipitation spreading across North Dakota behind the warm front as the low pressure system tracked to the northeast. (Courtesy of the Hydrometeorological Prediction Center.)
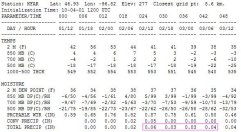
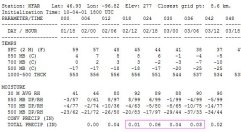
With a low pressure system passing to the east, it seemed likely that Fargo would receive some precipitation. The SREF 24-hr precipitation probabilities (Courtesy of Penn State University) indicated Fargo had about an 85% chance of receiving measurable precipitation during the forecast period. For the 24-hr precipitation totals, NAM was forecasting between 0.25 and 0.50 inches of precipitation while GFS was forecasting between 0.10 and 0.25 inches (both images courtesy of the Hydrometeorological Prediction Center). The grid interpolations were more agreeable with the NAM interpolation predicting 0.16 inches and the GFS interpolation predicting 0.14 inches.
|
|
The NAM grid interpolation (left), initialized at 12Z on April 1st, 2010, predicted Fargo to receive a total of 0.16 inches of precipitation while the GFS grid interpolation (right), initialized at 18Z on April 1st, 2010, predicted 0.14 inches of precipitation by the end of the forecast period. (Courtesy of Texas A&M University.)
The SREF Plume had more of a spread between the ensemble members and ranged from 0.03 to 0.75 inches by the end of the forecast period. The average mean was 0.13 inches with the majority of the models predicting under 0.12 inches.
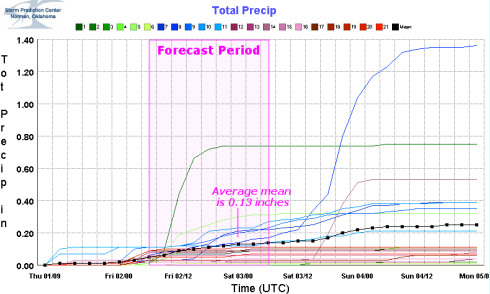
The SREF Plume for the forecast period, ranging from 06Z April 2nd, 2010 to 06Z April 3rd, 2010, showed a large spread between the ensemble members for precipitation totals with an average mean of 0.13 inches. While totals were varying, there was a strong consensus between the models that some measurable precipitation would fall. (Courtesy of the Storm Prediction Center.)
The WRF and AVN progs (see caption below) showed a large area of precipitation moving across North Dakota, including the Fargo area. The 30-hr WRF prog, valid at 18Z on April 2nd, showed upward motions of air over Fargo which would be conducive to precipitation falling around that time. It already predicted Fargo receiving 0.01 to 0.10 inches of precipitation in the 6-hr period from 12Z to 18Z. The prog also showed the approaching 500-mb trough and areas of vorticity over the Dakotas and Minnesota which provide divergence aloft for the system.
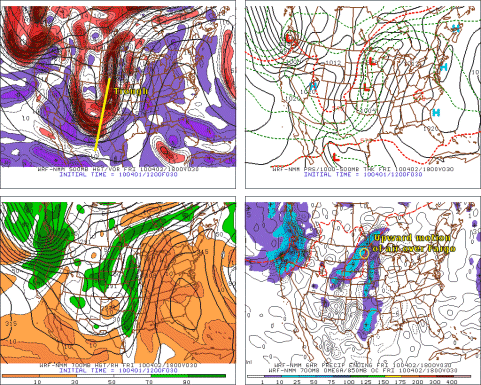
The 30-hr WRF prog, valid at 18Z on April 2nd, 2010, forecasted measurable precipitation to have already fallen between 12Z and 18Z with upward motions of air over Fargo which is conducive to precipitation occurring around that time. The forecast loops of the WRF and AVN progs show how an area of precipitation was expected to move over Fargo during the forecast period. (Courtesy of Penn State University.)
All signs pointed to Fargo receiving some measurable precipitation during the forecast period as the low pressure system passed by. By 2325Z on April 1st, radar imagery (see image; Courtesy of University Corporation for Atmospheric Research) already showed a large area of light to moderate precipitation across central North Dakota. I believed this area of precipitation would eventually spread eastward and affect Fargo.
Considering that 0.38 inches was the daily precipitation record for April 2nd (see almanac), I was hesitant to believe some of the higher totals since it did not look to be a record-breaking storm. Instead, I opted to go towards the lower side and forecasted Fargo to receive a total of 0.12 inches of precipitation. However, I was concerned that my forecast might be a little too low should an area of heavy precipitation develop behind the warm front. In the end, things turned out very differently.
 << Back | Top | Next >>


