
Lesson Learned
The high temperature for Little Rock on March 2nd, 2010 ended up being 44°F. This is 6°F lower than what I had predicted and 16°F lower than the normal temperature of 60°F for the day. The forecast bust caused me to finish in 400th place for that day in WxChallenge.
As I previously mentioned, whether or not the clouds associated with the low pressure system tracking south and east of Little Rock cleared in time was the challenging part of the forecast. I went with the majority of the computer models which were forecasting clouds to clear by the afternoon hours; however, this did not happen.
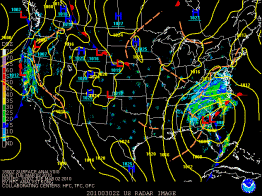
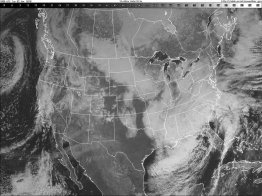
The 18Z surface analysis from March 2nd, 2010 showed the low pressure system and its associated precipitation to be well away from Little Rock. At this same time, the visible satellite image showed clouds from the system lingering over the entire state of Arkansas which contributed to the lower temperatures. METARs during the 24 hour forecast period confirmed that skies had a low overcast much of the day.

|

|
The 18Z surface forecast from March 2nd, 2010 (left) shows the low pressure system and precipitation well to the east of Little Rock, Arkansas. (Courtesy of the Hydrometeorological Prediction Center.) The 18Z visible satellite image from March 2nd, 2010 (right) shows clouds associated with the low pressure system lingering over Arkansas. (Courtesy of University Corporation for Atmospheric Research.)
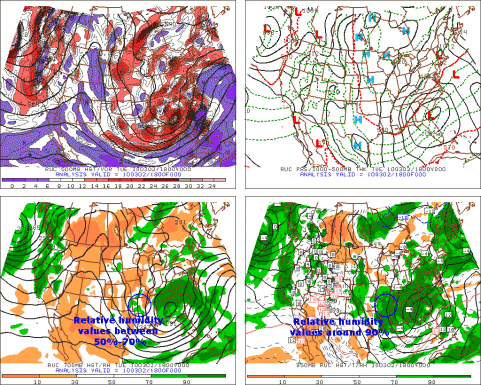
While the forecast progs predicted drier values of 700-mb relative humidity over Little Rock, which was a deciding factor for my forecast, one thing I overlooked was the 850-mb relative humidity. The 850-mb RUC analysis from 18Z on March 2nd, 2010 showed 700-mb relative humidity values between 50% to 70% while relative humidity values at 850-mb were 90%. This is a good reminder that the 700-mb relative humidity prog is not an absolute indicator of clouds. Had I checked the 850-mb relative humidity forecast, providing it was predicting higher relative humidity values at the time, this would have tipped me off that there was a stronger possibility of clouds lingering.

The 18Z RUC analysis from March 2nd, 2010 shows 850-mb relative humidity values to be 90% over Little Rock which is an indicator of clouds. (Courtesy of Penn State University.)
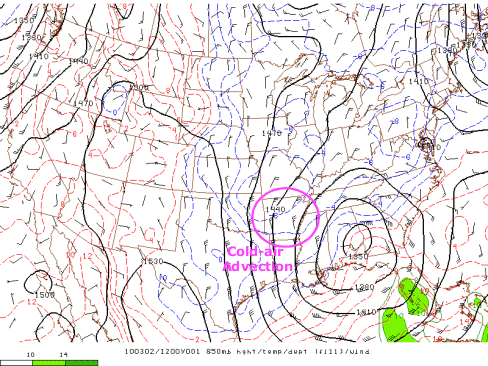
One other thing that contributed to my forecast bust that I did not account for was cold-air advection occurring behind the low pressure system. The 12Z 850-mb analysis from March 2nd, 2010 showed cold-air advection occurring across Arkansas. Had I given the big picture a little more thought, I would have realized this to be a possibility.

The 18Z 850-mb analysis from March 2nd, 2010 shows cold-air advection taking place over Arkansas. (Courtesy of the Storm Prediction Center.)
Looking back, I think the biggest lesson that I learned was not to discount the outlier models. While it is generally best to go with the strongest consensus between the models, it still does not guarantee an accurate forecast. Had I given it a little more thought, I would have realized that the outlier models might have fit the big picture a little better. Given the large size of the low pressure system, it makes sense that clouds likely would have lingered throughout the day. This lesson will be something that I will make sure to keep in the back of my mind when making future forecasts.
 << Back | Top | End >>


