
Fargo Climatology
Fargo, North Dakota is located in the Red River Valley of the North and on the western side of the northward flowing Red River, which is a part of the Hudson Bay drainage area. Fargo’s twin city, Moorhead, Minnesota, is located on the eastern side of the river. The Red River of the North has no significant impact on Fargo’s weather; however, the river is susceptible to springtime flooding due to melting snow, which is currently occurring in the early spring of 2010. The Local Climate Data indicates that Hector International Airport in Fargo lies at an elevation of 895 feet.

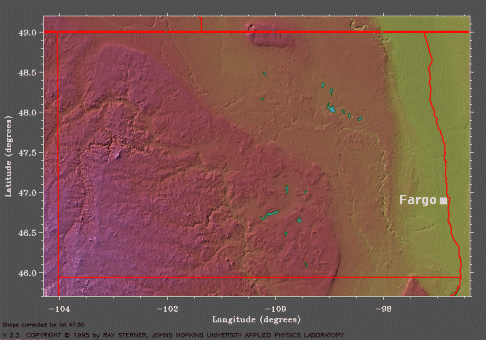
The topographical map of North Dakota shows that Fargo is located in the Red River Valley of the North with flat terrian around the city. (Courtesy of Johns Hopkins University.)
The terrain around Fargo is very flat and open, as can be seen on the topographical map above. This causes surface friction to have little effect on the wind. On occasion, northerly winds blowing up the valley can cause low clouds and fog but this happens rarely. Other than this, the topography causes no pronounced climatic differences in the Fargo area.
On average, March is the second snowiest month of the year for Fargo. Snowfall is possible through April, which is when the latest snow typically falls, and is usually light when it does occur. The Red River Valley of the North is in an area where precipitation amounts tend to be lighter in the west and heavier in the east.
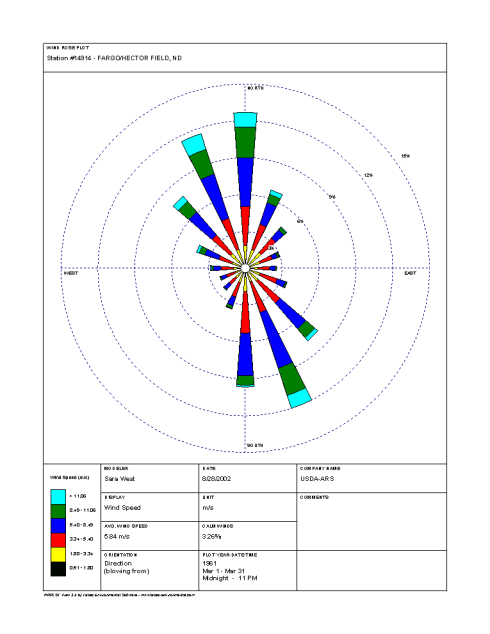
The March wind rose for Hector International Airport indicates that the most commonly observed wind direction is northerly and occurs approximately 13% of the time. South-southeasterly and north-northwesterly winds are also common and occur about 12% of the time, while southerly winds occur 10% of the time. Southeasterly and northwesterly winds occur 8% of the time, and north-northeasterly winds occur 7% of the time.

The March wind rose for Hector International Airport in Fargo shows that the most frequently observed wind direction is northerly. (Courtesy of the National Water and Climate Center.)
During the month of March, wind speeds between 3.34 m/s (6.5 knots) and 5.4 m/s (10.5 knots) occur about 3% of the time. Wind speeds between 5.4 m/s (10.5 knots) and 8.49 m/s (16.5 knots) occur approximately 5% of the time, and wind speeds between 8.49 m/s (16.5 knots) and 11.06 m/s (22.5 knots) occur a little over 2% of the time. The Local Climate Data indicates that the maximum 2-minute wind speed for March is 49 mph (43 knots).
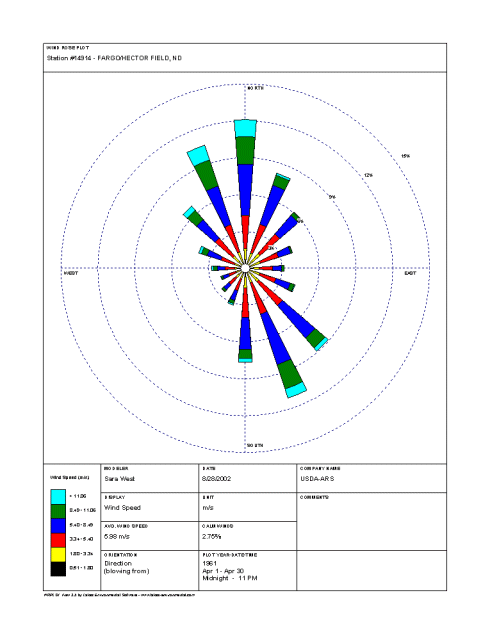
By April, northerly is still the most frequently observed wind direction, according to the April wind rose, and occurs 12% of the time. Winds out of the south-southeast and north-northwest occur 11% of the time, while southeasterly winds occur 9% of the time. North-northeasterly and southerly winds occur approximately 8% of the time, and northwesterly winds occur 7% of the time.

The April wind rose for Hector International Airport shows that the most frequently observed wind direction is still northerly. (Courtesy of the National Water and Climate Center.)
Throughout April, wind speeds between 3.34 m/s (6.5 knots) and 5.4 m/s (10.5 knots) occur 3% of the time during the month. Wind speeds between 5.4 m/s (10.5 knots) and 8.49 m/s (16.5 knots) occur 5% of the time, while wind speeds between 8.49 m/s (16.5 knots) and 11.06 m/s (22.5 knots) occur just over 2% of the time. The Local Climate Data indicates that the maximum 2-minute wind speed for April is 49 mph (43 knots).
According to the Daily Almanacs for the first forecasting week (March 23rd, March 24th, March 25th, and March 26th), the normal daily high for March 23rd is 39°F, the normal daily high for March 24th and 25th is 40°F, and the normal daily high for March 26th is 41°F. The record high temperatures for this period are, chronologically, 73°F, 70°F, 67°F, and 68°F, and the record lowest maximum temperatures are, chronologically, -1°F, 14°F, 10°F, and 12°F.
The normal daily low for March 23rd is 22°F, the normal daily low for March 24th and 25th is 23°F, and the normal daily low for March 26th is 24°F. For these days, the record low temperatures are, chronologically, -16°F, -11°F, -10°F, and -12°F, and the record highest minimum temperatures are, chronologically, 44°F, 48°F, 48°F, and 43°F.
The average daily precipitation for March 23rd, 24th, 25th, and 26th is consistently 0.04 inches and the record daily precipitation is, chronologically, 0.90 inches, 0.40 inches, 0.94 inches, and 1.07 inches.
For the second forecasting week (March 30th, March 31st, April 1st, and April 2nd), the Daily Almanacs indicate that the normal daily high for March 30th and 31st is 44°F, the normal daily high for April 1st is 45°F, and the normal daily high for April 2nd is 46°F. The record high temperatures are, chronologically, 78°F, 77°F, 68°F, and 67°F, and the record lowest maximum temperatures are, chronologically, 14°F, 15°F, 19°F, and 15°F.
The normal daily low for March 30th is 25°F, the normal daily low for March 31st and April 1st is 26°F, and the normal daily low for April 2nd is 27°F. The record low temperatures for these days are, chronologically, -14°F, 2°F, -7°F, and 0°F, and the record highest minimum temperatures are, chronologically, 41°F, 43°F, 42°F, and 41°F.
The average daily precipitation for March 30th and 31st and April 1st and 2nd is consistently 0.04 inches and the record daily precipitation is, chronologically, 0.38 inches, 0.60 inches, 0.67 inches, and 0.38 inches.
Now that we have an idea of what is typical for early April in Fargo, let’s take a look at the big picture surrounding the synoptic-scale weather pattern on April 1st, 2010. I will also explain how I formulated my precipitation forecast for April 2nd, 2010.
 << Back | Top | Next >>


